Reporting
Q provides robust reporting capabilities, facilitating in-depth analysis and decision-making. With customizable graphs and charts, users can visualize data effectively. Its risk analysis tools offer comprehensive insights into potential risks and mitigation strategies. Questionnaire result reporting enables the synthesis of survey data for actionable insights. Data drill-down functionality allows users to explore data at granular levels for deeper understanding.
Moreover, Q offers seamless data export options, whether through the user interface or API, ensuring compatibility and ease of integration with external systems. These features collectively empower users to extract maximum value from their data, driving informed decision-making processes.

Features
Graphs
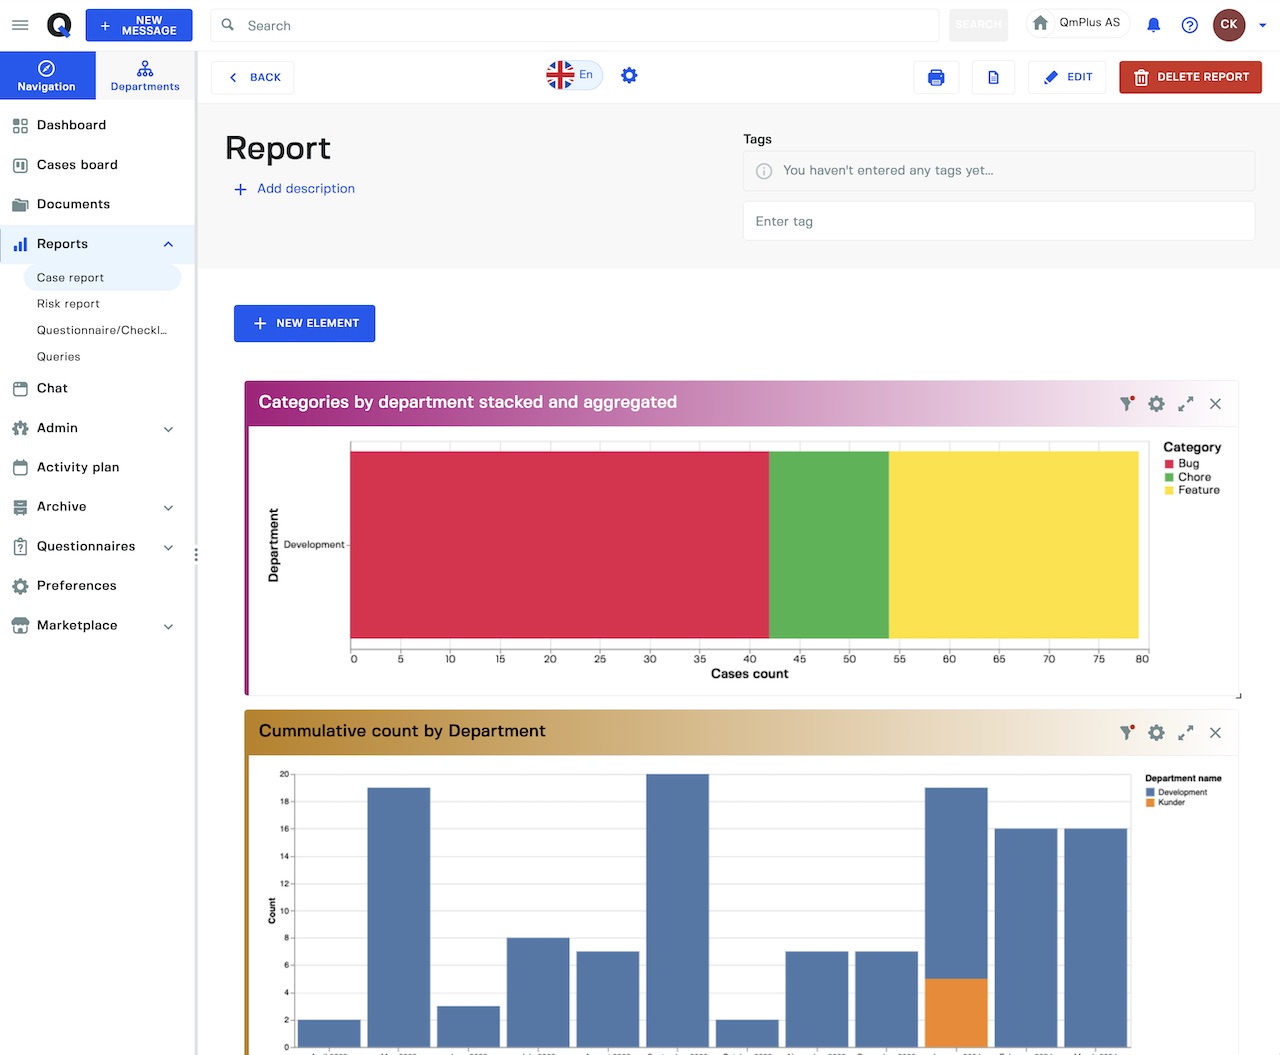
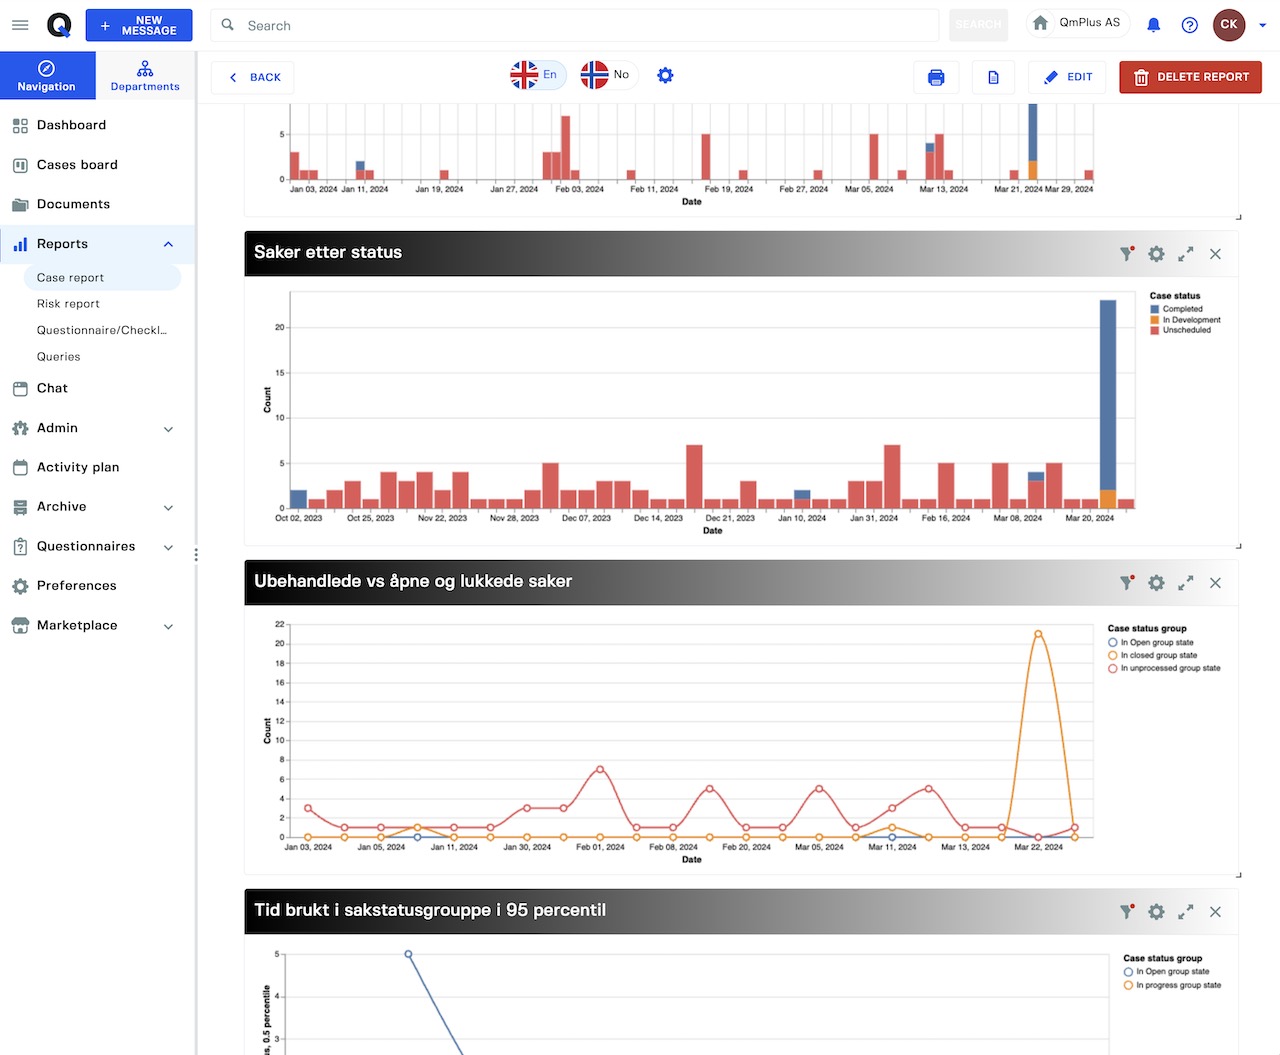
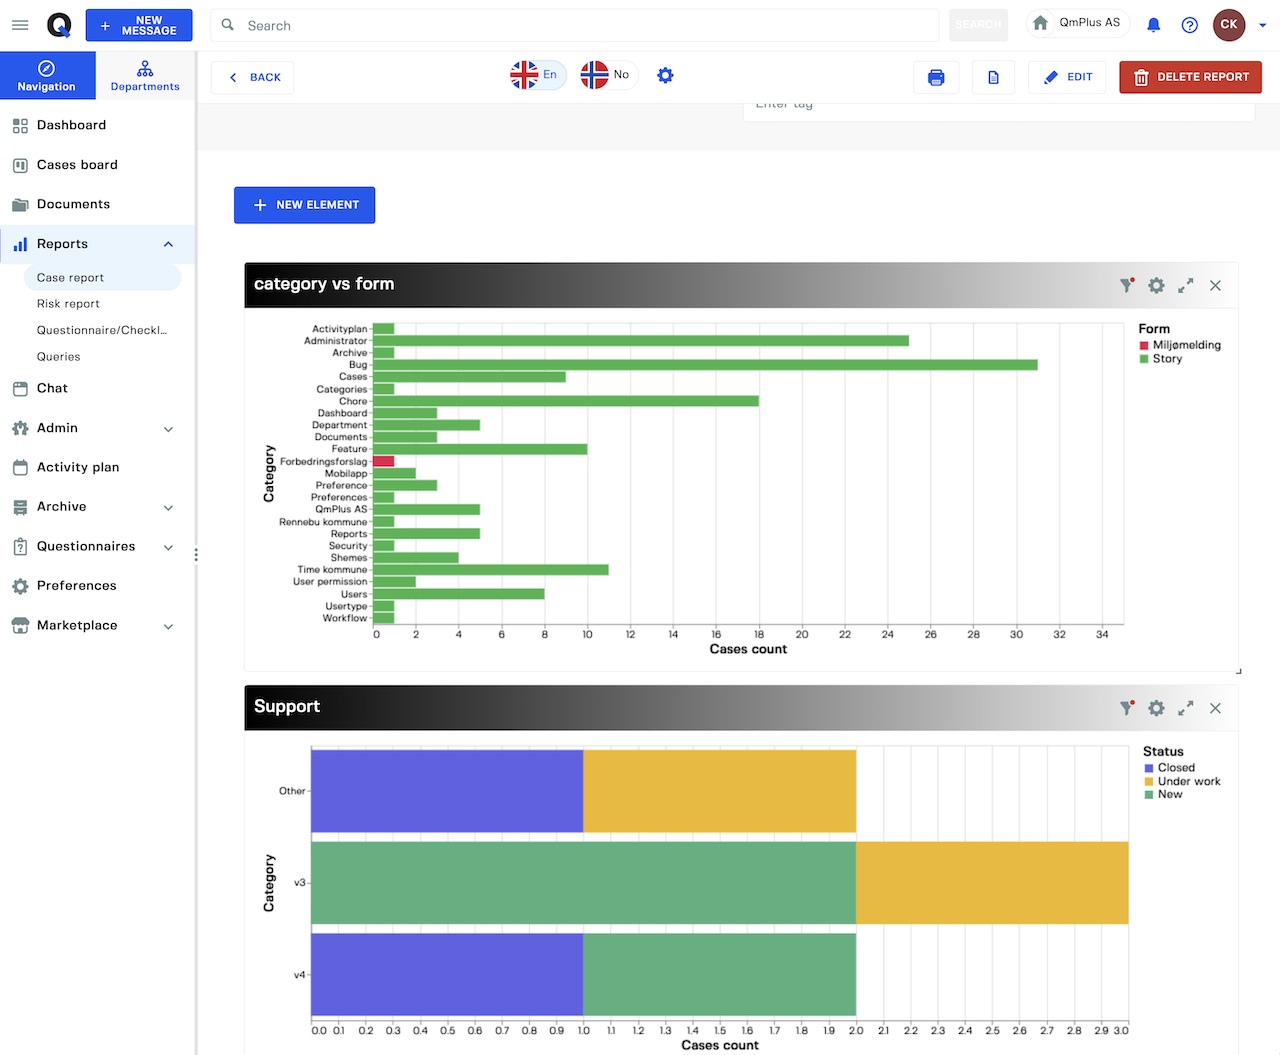
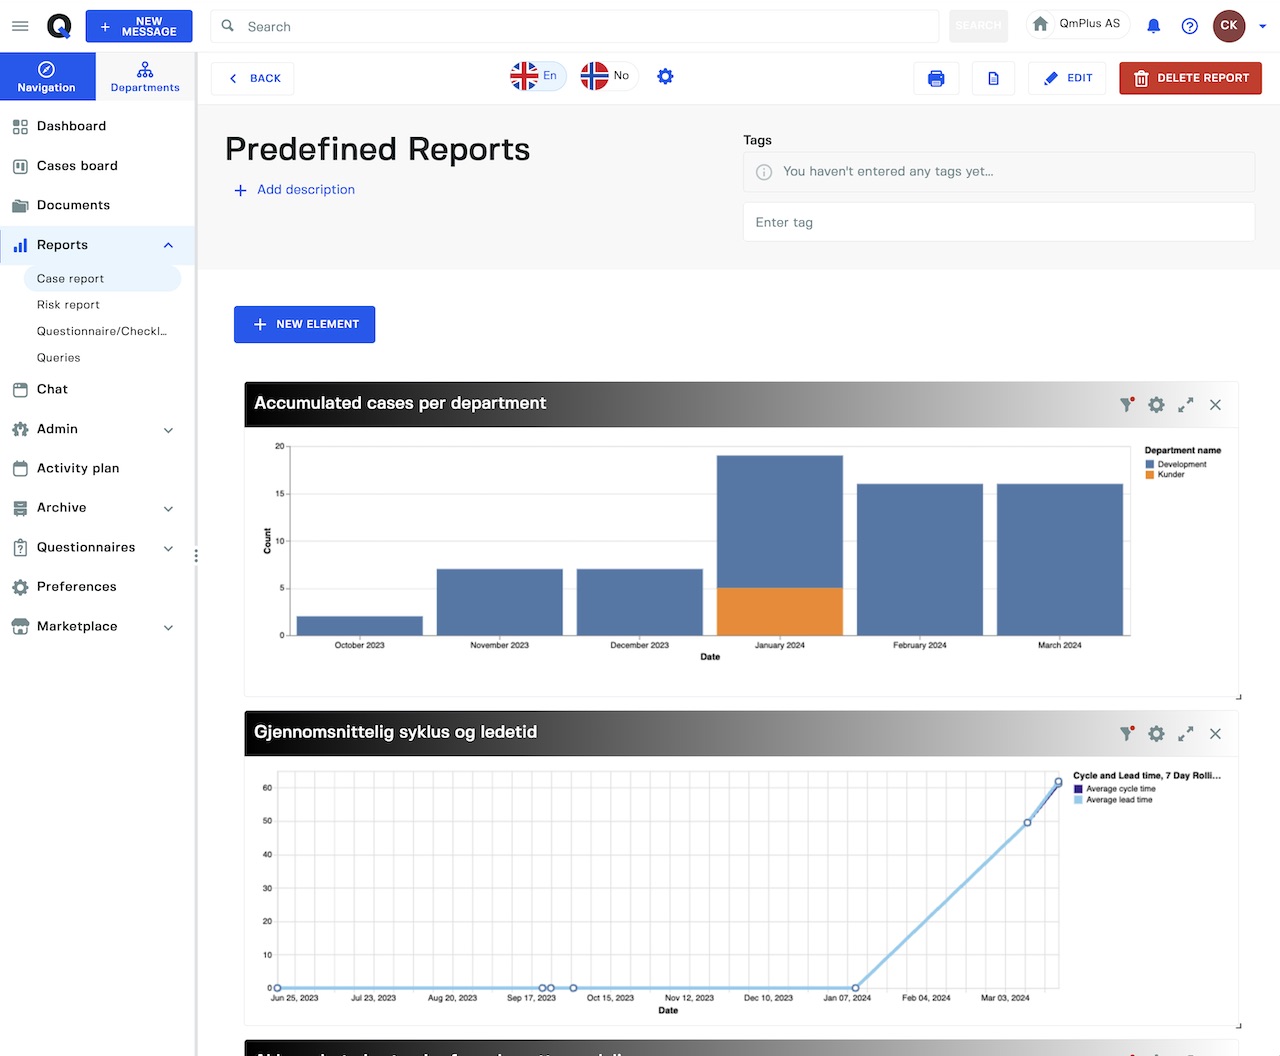
An extensive selection of graphs are available to report on the data in Q. From traditional bar, line and pie charts to more extensive pre-defined graph that let you see correlation between categories registered on form entries.
Use the department hierarchy to drill down in the data by organisational department allowing you to zoom into the organisation or compare departments.
Risk Analysis
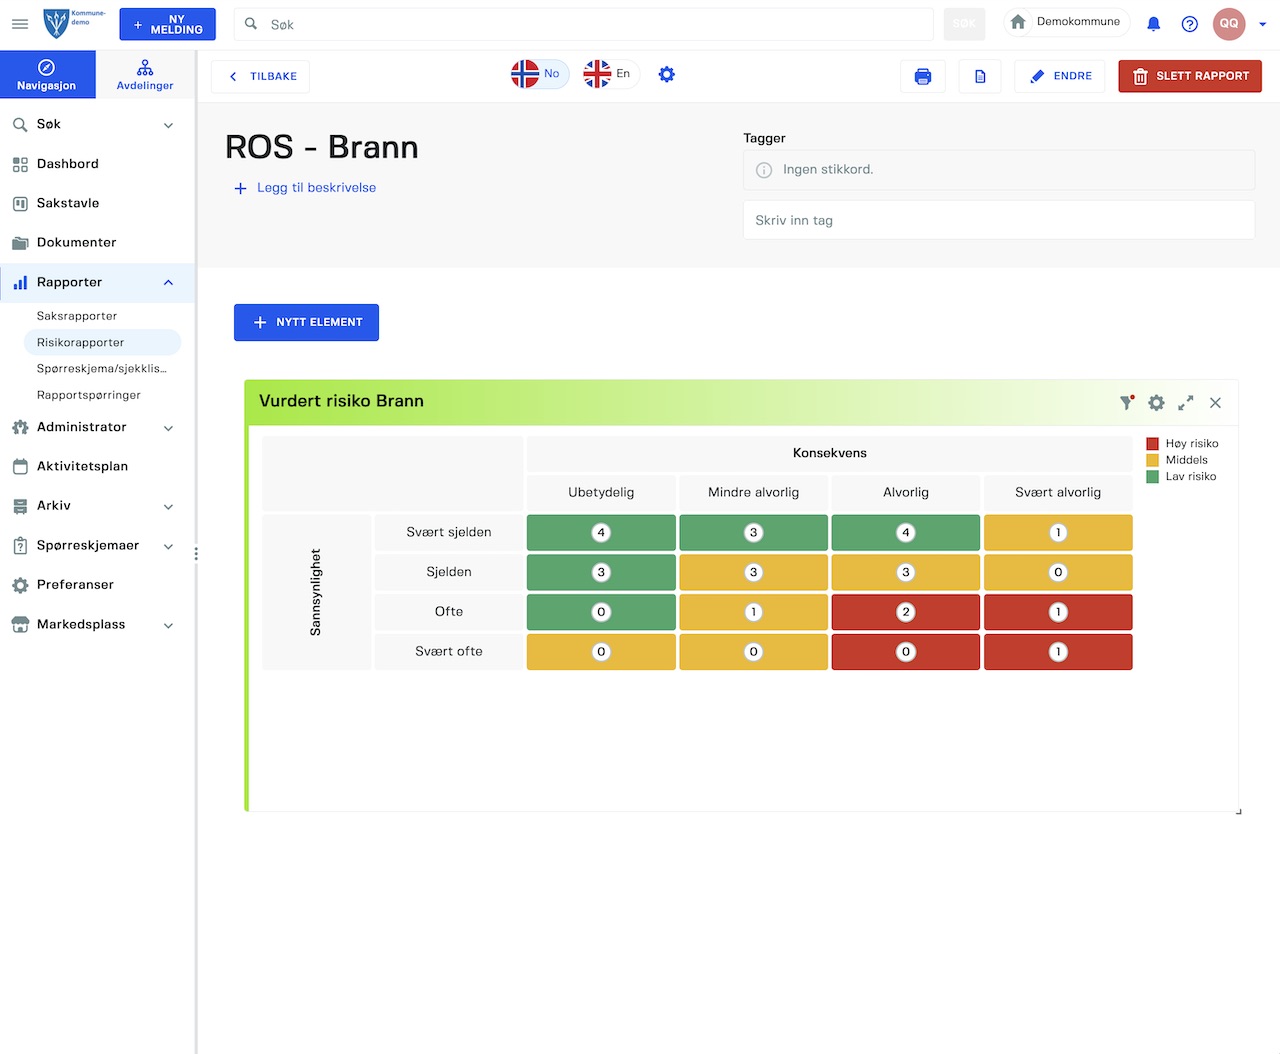
Create custom risk models and define risk category groups that rely on your custom model. Calculate the risk score forms in Q.
Click through on the risk matrix graph to see what form entries are related to the score allowing you to quickly focus in on the high risk items in your organisation.
Use the department hierarchy to drill down in the data by organisational department allowing you to zoom into the organisation or compare departments.
Questionnaires
Send out questionnaires to your users using our activity calendar and use our reporting functionality to summarise the results from the questionnaire. Slice and dice the data using filters to dig into the results.
Use the department hierarchy to drill down in the data by organisational department allowing you to zoom into the organisation or compare departments.
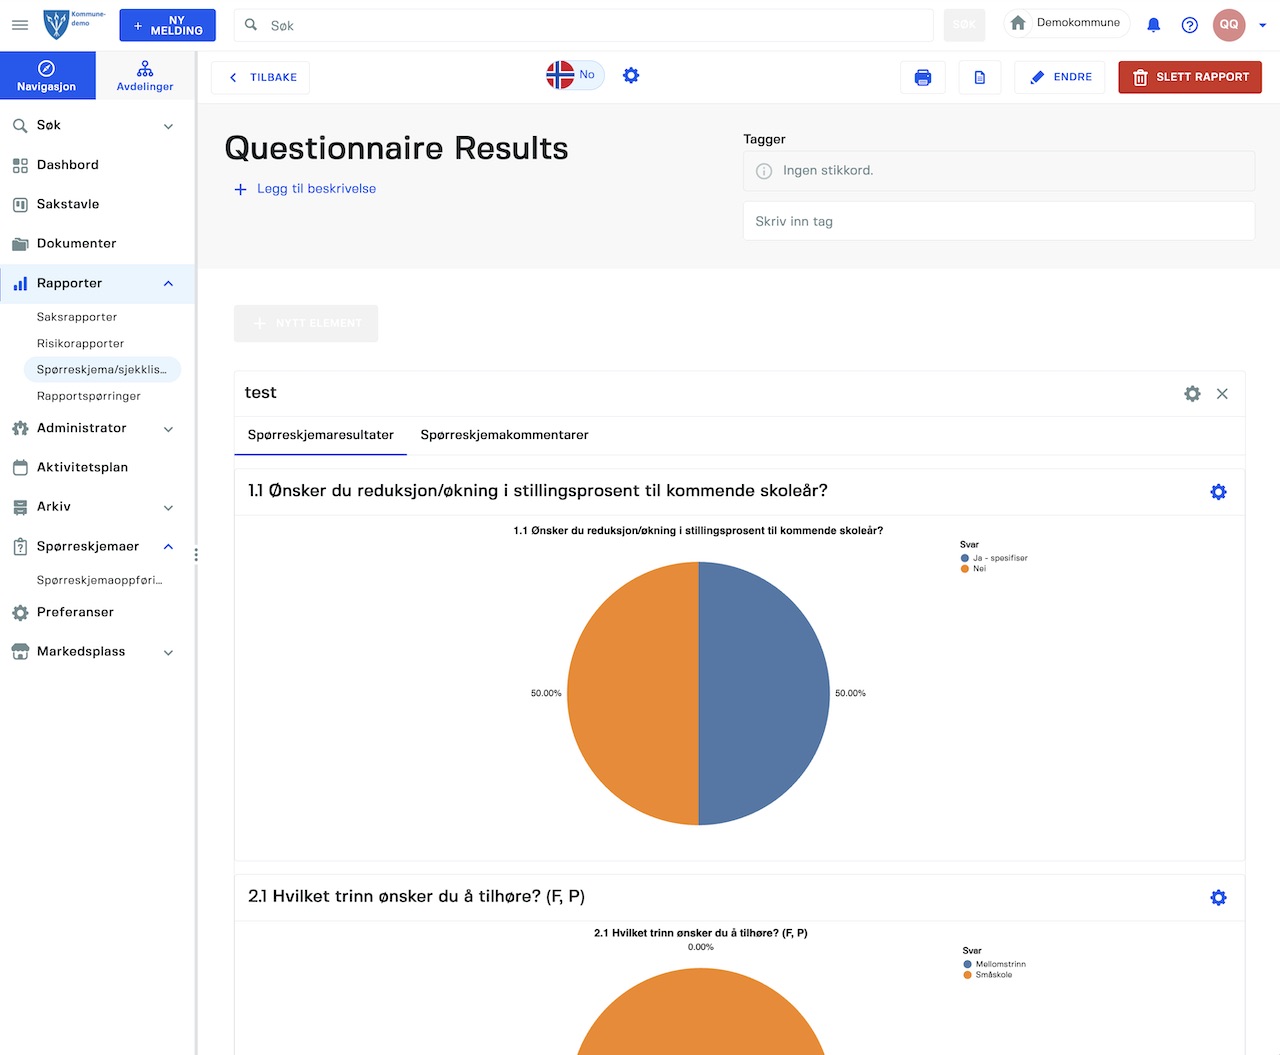
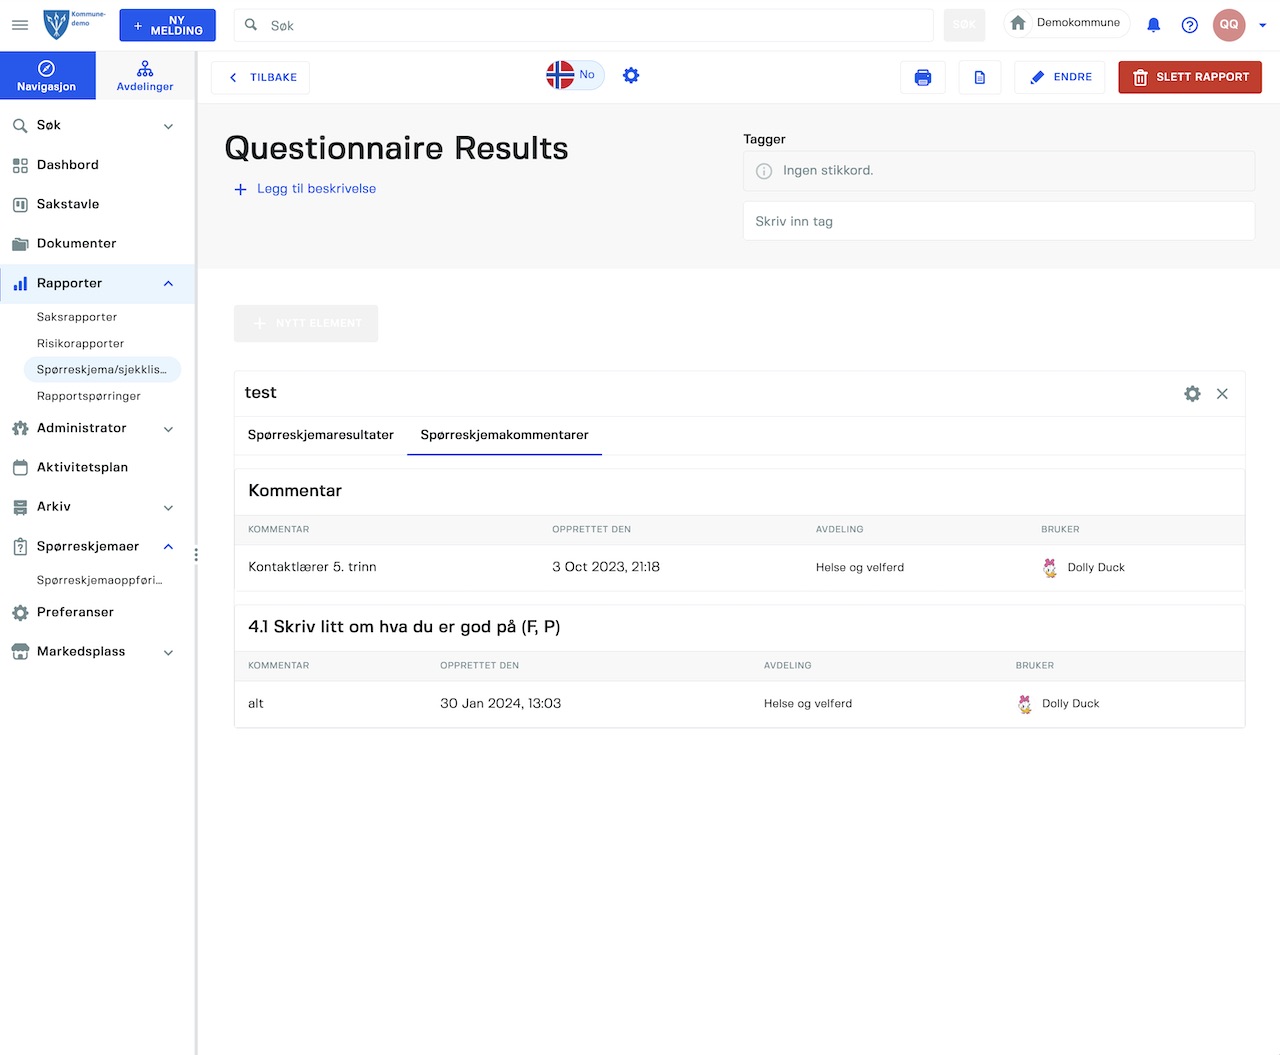
Table View
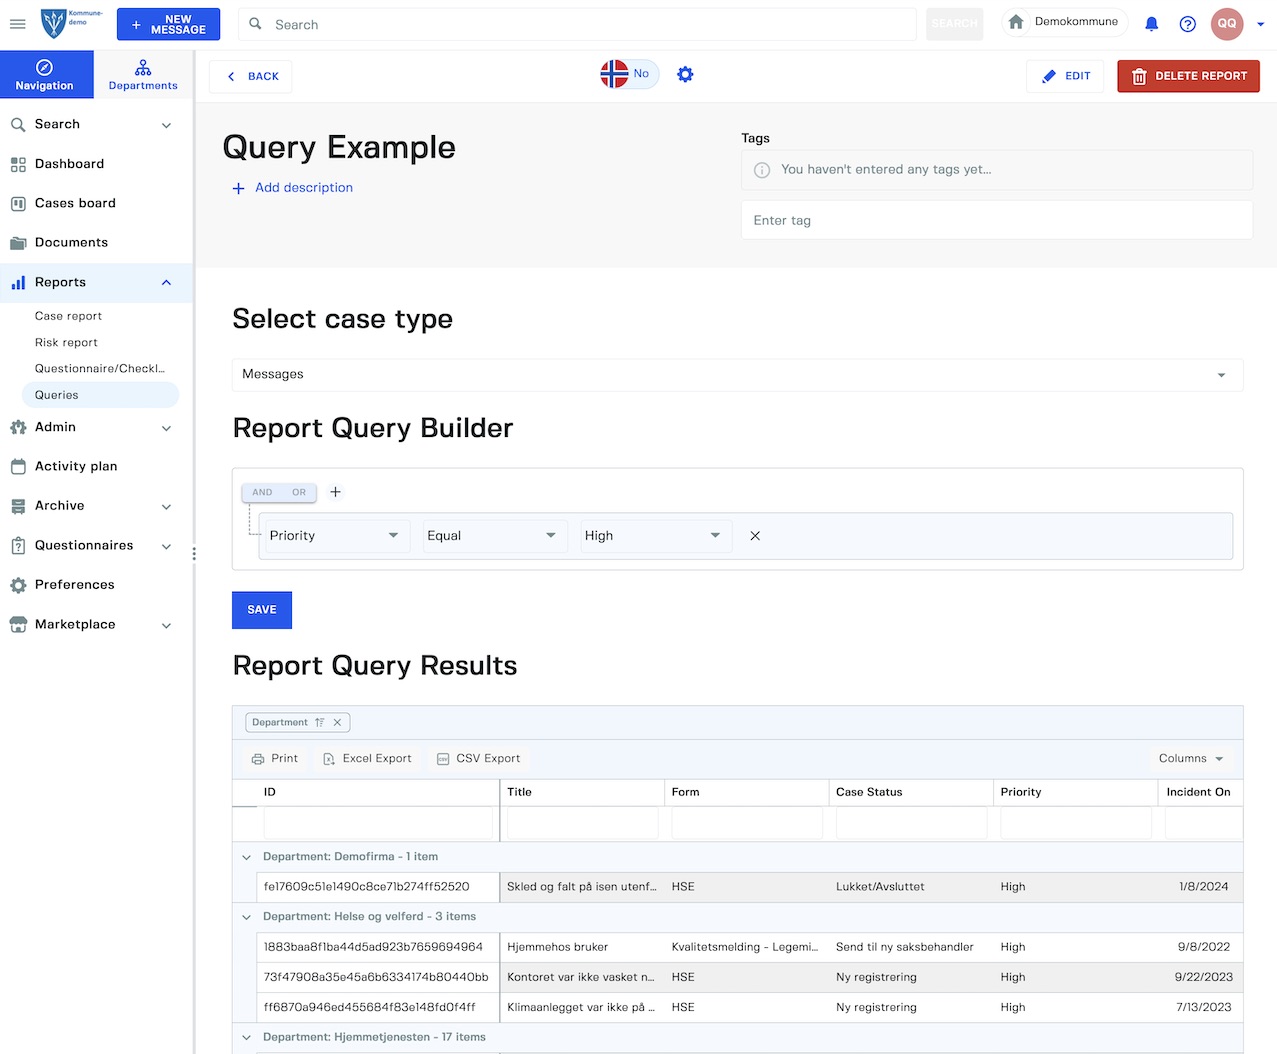
Our query reports allows you to build table based reports that can then be used to export the data in Excel or CSV format for further processing locally at the customer.
Advanced features such as grouping of data lets you do basic operations directly in the ui before exporting the data.
